- Home
- Commercial and asset owners
Know what every site is saving, against the tariff it is actually on.
PVBiz monitors commercial solar sites across 14+ inverter brands and platforms, with savings against the real Eskom or municipal tariff, PPA billing, REC and carbon tracking, scheduled reports and fault alerts. One or two sites from R55 a month; portfolios are priced per fleet.
No hardware. Read-only access through the manufacturer cloud the site already reports to.
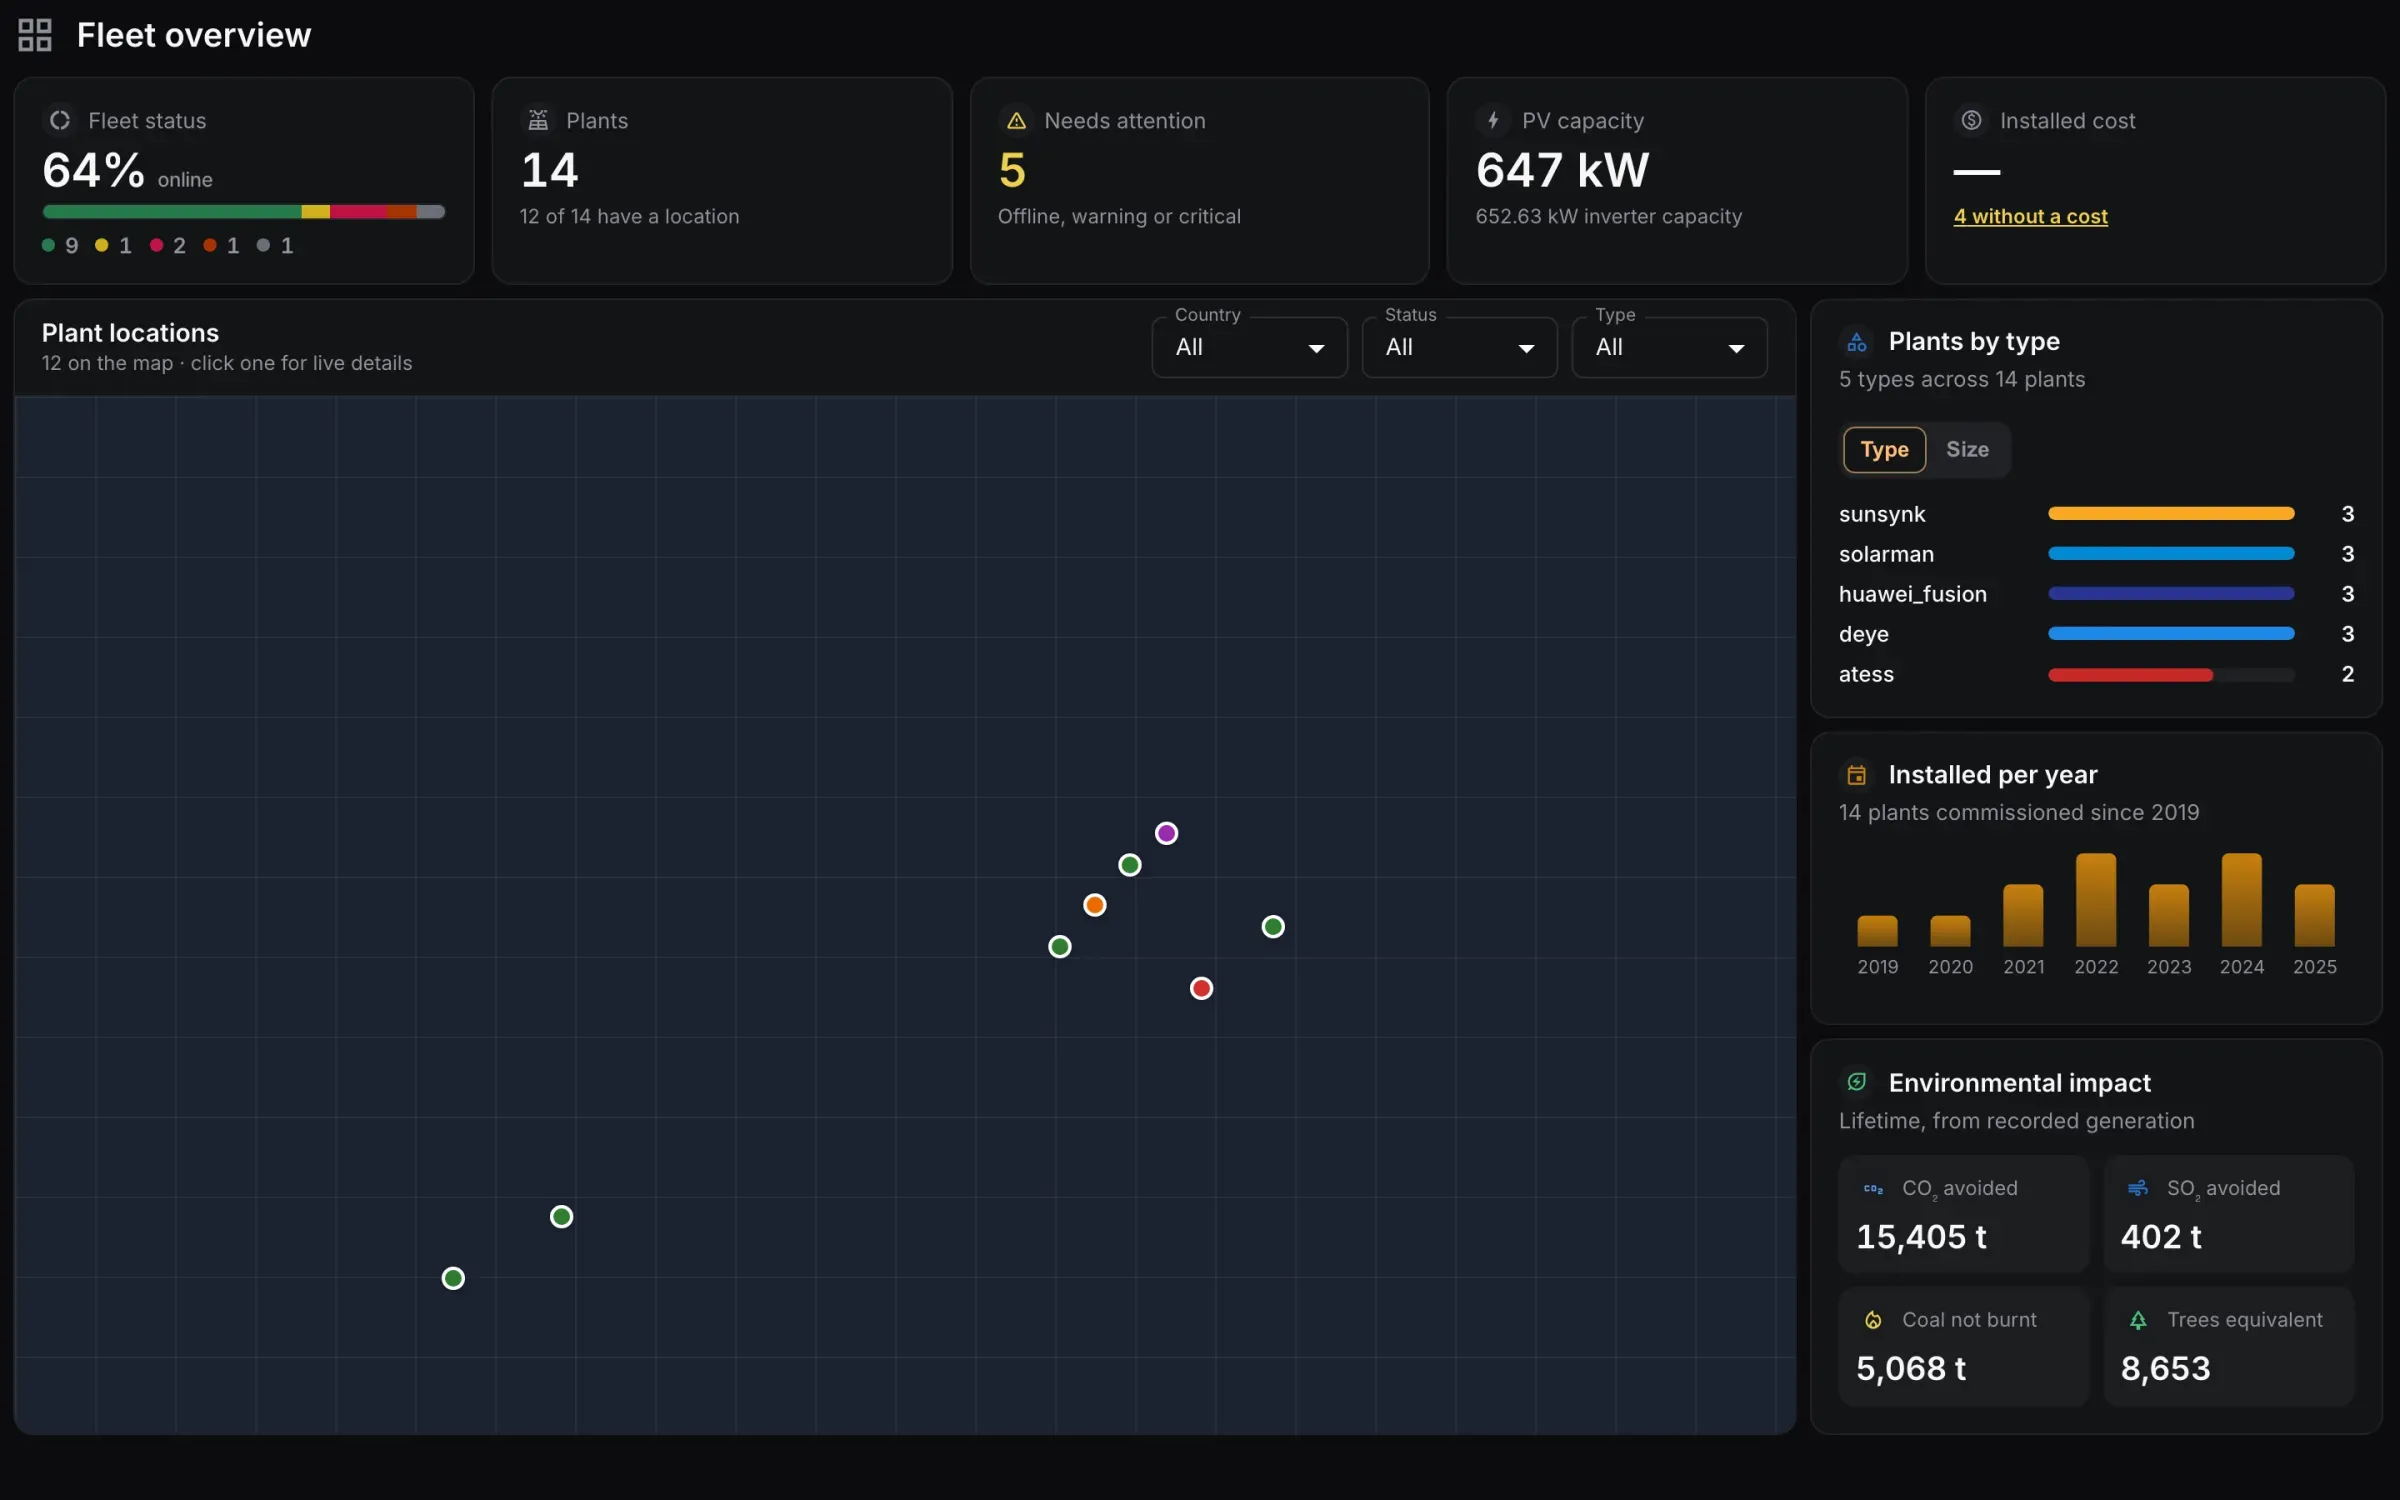
Whatever the installer fitted, it is one view
Sites on different brands, bought from different installers, sit in one dashboard with one set of numbers.


What asset owners get
Savings against the real tariff
An Eskom and municipal tariff library, so the rand figure on the report is what the site avoided paying, not an estimate.
PPA billing
PPA agreements and price templates, with the energy delivered and the amount due calculated per period.
Carbon and REC tracking
CO2 avoided and renewable energy certificates from recorded generation, ready for ESG reporting.
Fault and underperformance alerts
Downtime, faults and sites producing below forecast reach you and your installer as they happen.
Performance index and forecasting
Actual yield against a weather-aware forecast over 7, 30, 90 days and a year, so an underperforming site shows up before the invoice does.
Scheduled reports
Performance and savings reports generated and emailed on a schedule, in PDF or Excel, for the people who sign off on the asset.
Every site, ranked
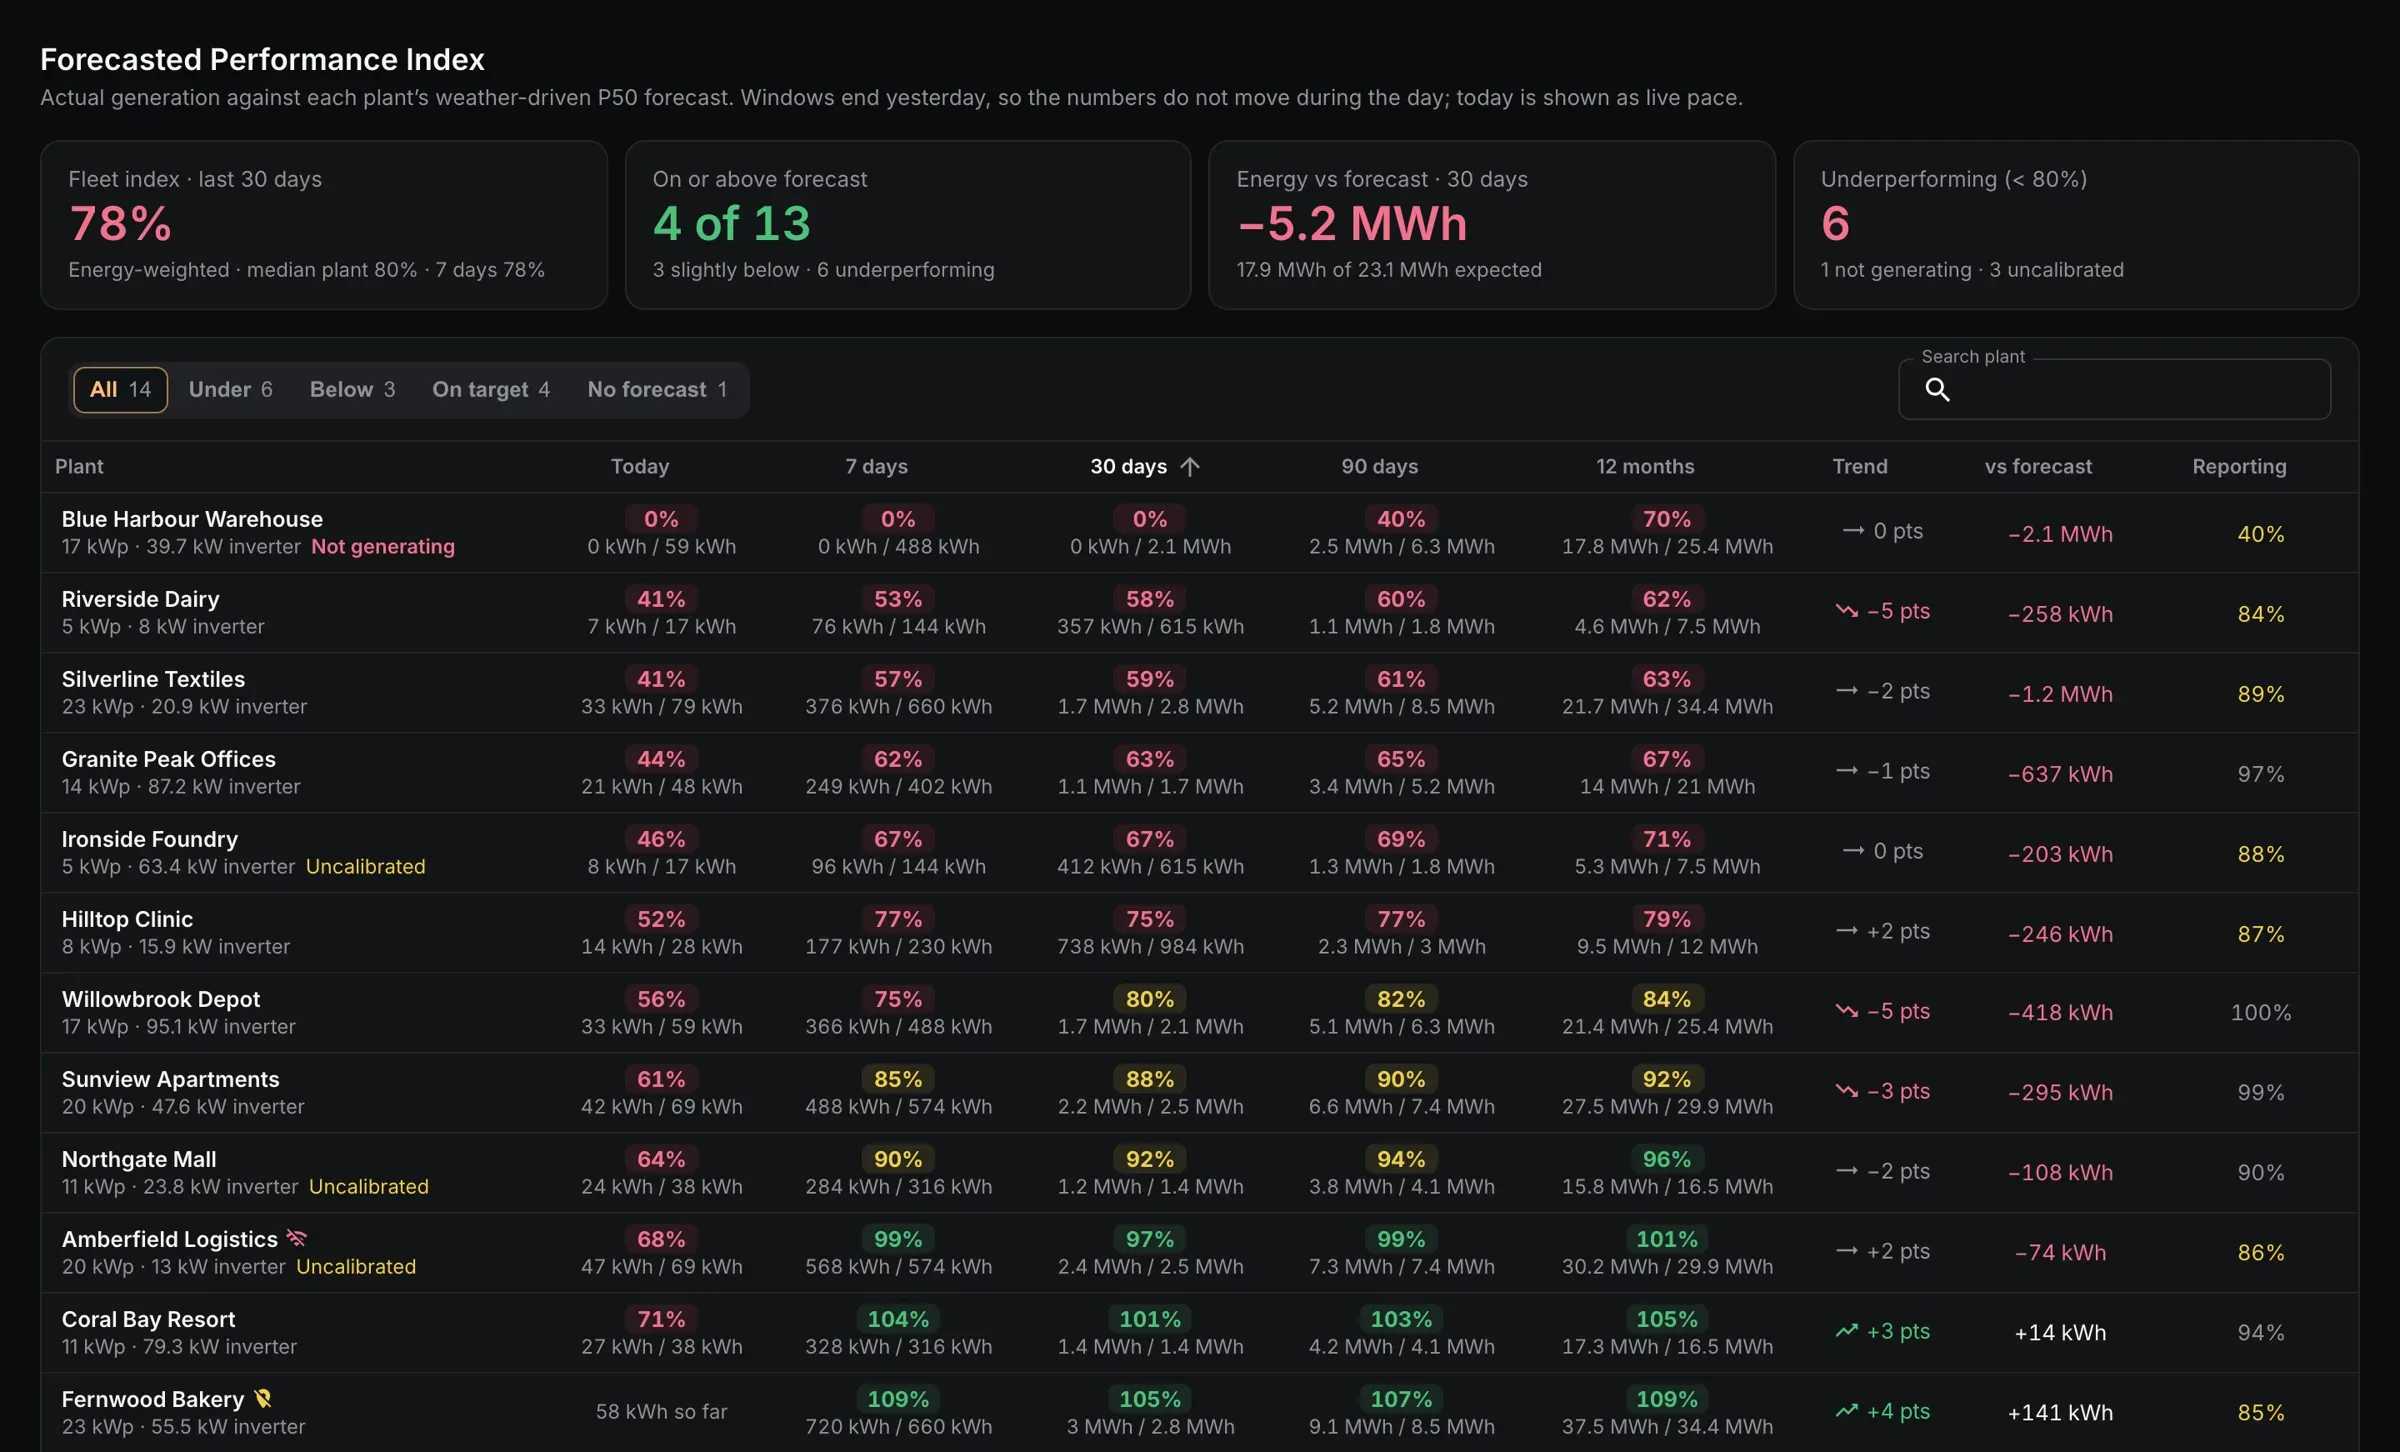
Actual against forecast, per site
The performance index colours every site by yield against forecast across 7, 30 and 90-day and yearly windows. The ones losing money stand out without a spreadsheet.
- Weather-aware forecast per site
- Peer benchmark by size tier
- Export to Excel for the board pack
Commercial questions
Is PVBiz for a single commercial site or a portfolio?
How are savings calculated?
Can we report carbon and renewable energy certificates?
Do we need to replace the monitoring the installer put in?
See your own sites on PVBiz.
We connect a site or two and walk you through the savings, PPA and REC figures. Or sign in if you already have an account.